11 Sensor Customer Buying Criteria - 11.3 Perceptual Map
11.3 Perceptual Map
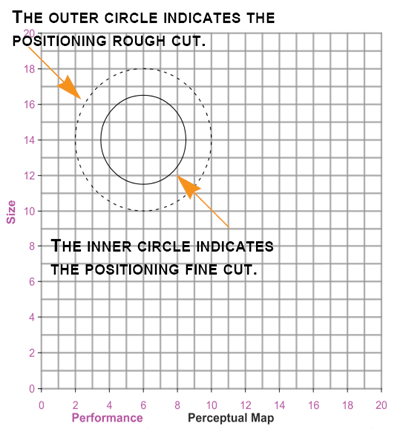
A perceptual map is a tool used by marketers to graphically compare characteristics of competing sets of products. The Capstone® and Foundation® perceptual map compares sensor weight and girth, measured as size on the vertical axis, and speed of operation, measured as performance on the horizontal axis.
Each segment has its own preference for sensor size and performance, which are defined by segment circles on the map. The inner fine cut circle has a radius of 2.5 units. It represents the heart of the segment where demand is strong. In addition, each inner circle has an ideal spot, a location where demand is strongest. The larger outer rough cut circle has a radius of 4.0 units. It represents the outer fringe of the segment, where demand is weak.

 |
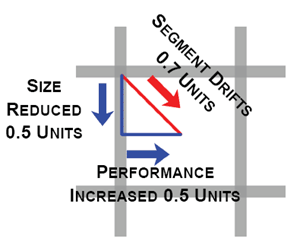
Each year, customers demand smaller, better performing products. This causes the segments to move or drift across the map. For example, in the Low End (Capstone®) and Low Tech (Foundation®) segments, size expectations decrease by 0.5 units and performance expectations increase by 0.5 units, moving the segment center 0.7 units across the map. |
