Capstone® and Foundation® companies manufacture electronic sensors. Other manufacturers install these as components in their products, where sensors measure physical conditions such as speed, temperature and pressure.
Manufacturers with similar sensor needs fall into Market Segments. In Capstone® the segments are called:
In Foundation® the segments are called:
The criteria from the year prior to Round 1 (Round 0) display below.
In Capstone®, price ranges in all segments drop $0.50 per year. For example, in Round 1 the Traditional price range will be $19.50-$29.50, in Round 2 it will be $19.00-$29.00. In Foundation®, price ranges remain constant round after round.
Positioning criteria for Capstone® and Foundation® change each round (see 10.4 Capstone® Segment and Ideal Spot Drift and 10.5 Foundation® Segment and Ideal Spot Drift ).
Age and reliability (MTBF) criteria remain constant round after round for both Capstone® and Foundation®.
Traditional customers seek proven products using current technology.
Low End customers seek proven products, are indifferent to technological sophistication and are price motivated.
High End customers seek cutting-edge technology in both size and performance.
Performance customers seek high reliability and cutting edge performance technology.
Size customers seek cutting edge size technology.
Low Tech customers seek proven products, are indifferent to technological sophistication and are price motivated.
High Tech customers seek cutting-edge technology in both size and performance.
A perceptual map is a tool used by marketers to graphically compare characteristics of competing sets of products. The Capstone® and Foundation® perceptual map compares sensor weight and girth, measured as size on the vertical axis, and speed of operation, measured as performance on the horizontal axis.
Each segment has its own preference for sensor size and performance, which are defined by segment circles on the map. The inner fine cut circle has a radius of 2.5 units. It represents the heart of the segment where demand is strong. In addition, each inner circle has an ideal spot, a location where demand is strongest. The larger outer rough cut circle has a radius of 4.0 units. It represents the outer fringe of the segment, where demand is weak.
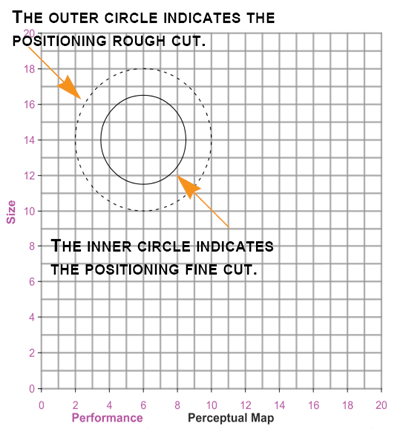
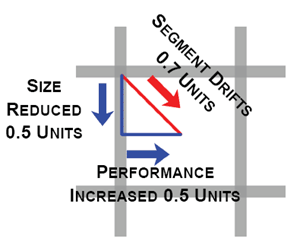 |
Each year, customers demand smaller, better performing products. This causes the segments to move or drift across the map. For example, in the Low End (Capstone®) and Low Tech (Foundation®) segments, size expectations decrease by 0.5 units and performance expectations increase by 0.5 units, moving the segment center 0.7 units across the map. |
| Traditional Fine Cut Circles: The location at the end of Round 0 is to the upper left, the location at the end of Round 8 is to the lower right. | |||||||||
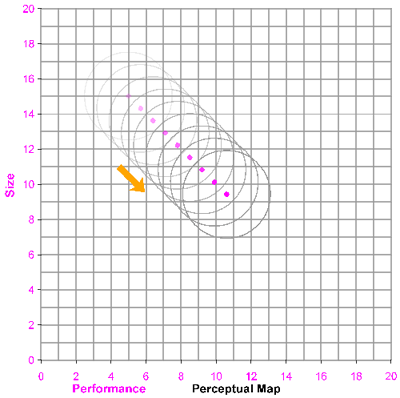 | |||||||||
| Drift Rate: Each year, the segment moves this distance on the Perceptual Map - the segment drifts 1/12th of this distance each month. | |||||||||
| | Pfmn | Size | | ||||||
| +0.7 | -0.7 | ||||||||
| Ideal Spot Offests: The Ideal Spot location relative to the segment center. | |||||||||
| | Pfmn | Size | | ||||||
| 0.0 | 0.0 | ||||||||
| Locations: Segment center and ideal spot locations at the end of each round. | |||||||||
| | | Segment Center | | | Ideal Spot | |||||
| Round | Pfmn | Size | Round | Pfmn | Size | |||||
| 0 | 5.0 | 15.0 | 0 | 5.0 | 15.0 | |||||
| 1 | 5.7 | 14.3 | 1 | 5.7 | 14.3 | |||||
| 2 | 6.4 | 13.6 | 2 | 6.4 | 13.6 | |||||
| 3 | 7.1 | 12.9 | 3 | 7.1 | 12.9 | |||||
| 4 | 7.8 | 12.2 | 4 | 7.8 | 12.2 | |||||
| 5 | 8.5 | 11.5 | 5 | 8.5 | 11.5 | |||||
| 6 | 9.2 | 10.8 | 6 | 9.2 | 10.8 | |||||
| 7 | 9.9 | 10.1 | 7 | 9.9 | 10.1 | |||||
| 8 | 10.6 | 9.4 | 8 | 10.6 | 9.4 | |||||
| Low End Fine Cut Circles: The location at the end of Round 0 is to the upper left, the location at the end of Round 8 is to the lower right. | |||||||||
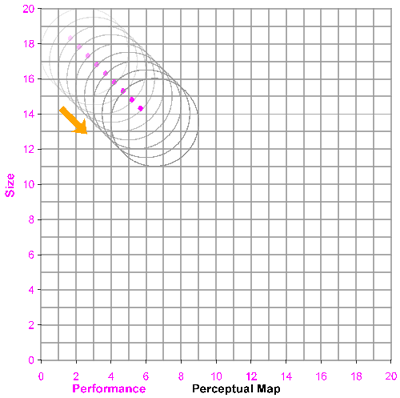 | |||||||||
| Drift Rate: Each year, the segment moves this distance on the Perceptual Map - the segment drifts 1/12th of this distance each month. | |||||||||
| | Pfmn | Size | | ||||||
| +0.5 | -0.5 | ||||||||
| Ideal Spot Offests: The Ideal Spot location relative to the segment center. | |||||||||
| | Pfmn | Size | | ||||||
| -0.8 | +0.8 | ||||||||
| Locations: Segment center and ideal spot locations at the end of each round. | |||||||||
| | | Segment Center | | | Ideal Spot | |||||
| Round | Pfmn | Size | Round | Pfmn | Size | |||||
| 0 | 2.5 | 17.5 | 0 | 1.7 | 18.3 | |||||
| 1 | 3.0 | 17.0 | 1 | 2.2 | 17.8 | |||||
| 2 | 3.5 | 16.5 | 2 | 2.7 | 17.3 | |||||
| 3 | 4.0 | 16.0 | 3 | 3.2 | 16.8 | |||||
| 4 | 4.5 | 15.5 | 4 | 3.7 | 16.3 | |||||
| 5 | 5.0 | 15.0 | 5 | 4.2 | 15.8 | |||||
| 6 | 5.5 | 14.5 | 6 | 4.7 | 15.3 | |||||
| 7 | 6.0 | 14.0 | 7 | 5.2 | 14.8 | |||||
| 8 | 6.5 | 13.5 | 8 | 5.7 | 14.3 | |||||
| High End Fine Cut Circles: The location at the end of Round 0 is to the upper left, the location at the end of Round 8 is to the lower right. | |||||||||
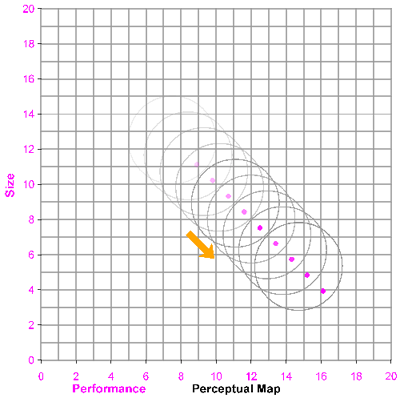 | |||||||||
| Drift Rate: Each year, the segment moves this distance on the Perceptual Map - the segment drifts 1/12th of this distance each month. | |||||||||
| | Pfmn | Size | | ||||||
| +0.9 | -0.9 | ||||||||
| Ideal Spot Offests: The Ideal Spot location relative to the segment center. | |||||||||
| | Pfmn | Size | | ||||||
| +1.4 | -1.4 | ||||||||
| Locations: Segment center and ideal spot locations at the end of each round. | |||||||||
| | | Segment Center | | | Ideal Spot | |||||
| Round | Pfmn | Size | Round | Pfmn | Size | |||||
| 0 | 7.5 | 12.5 | 0 | 8.9 | 11.1 | |||||
| 1 | 8.4 | 11.6 | 1 | 9.8 | 10.2 | |||||
| 2 | 9.3 | 10.7 | 2 | 10.7 | 9.3 | |||||
| 3 | 10.2 | 9.8 | 3 | 11.6 | 8.4 | |||||
| 4 | 11.1 | 8.9 | 4 | 12.5 | 7.5 | |||||
| 5 | 12.0 | 8.0 | 5 | 13.4 | 6.6 | |||||
| 6 | 12.9 | 7.1 | 6 | 14.3 | 5.7 | |||||
| 7 | 13.8 | 6.2 | 7 | 15.2 | 4.8 | |||||
| 8 | 14.7 | 5.3 | 8 | 16.1 | 3.9 | |||||
| Performance Fine Cut Circles: The location at the end of Round 0 is to the upper left, the location at the end of Round 8 is to the lower right. | |||||||||
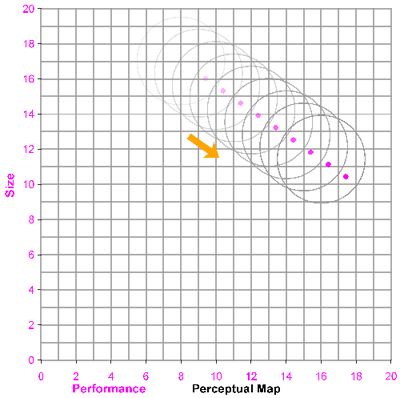 | |||||||||
| Drift Rate: Each year, the segment moves this distance on the Perceptual Map - the segment drifts 1/12th of this distance each month. | |||||||||
| | Pfmn | Size | | ||||||
| +1.0 | -0.7 | ||||||||
| Ideal Spot Offests: The Ideal Spot location relative to the segment center. | |||||||||
| | Pfmn | Size | | ||||||
| +1.4 | -1.0 | ||||||||
| Locations: Segment center and ideal spot locations at the end of each round. | |||||||||
| | | Segment Center | | | Ideal Spot | |||||
| Round | Pfmn | Size | Round | Pfmn | Size | |||||
| 0 | 8.0 | 17.0 | 0 | 9.4 | 16.0 | |||||
| 1 | 9.0 | 16.3 | 1 | 10.4 | 15.3 | |||||
| 2 | 10.0 | 15.6 | 2 | 11.4 | 14.6 | |||||
| 3 | 11.0 | 14.9 | 3 | 12.4 | 13.9 | |||||
| 4 | 12.0 | 14.2 | 4 | 13.4 | 13.2 | |||||
| 5 | 13.0 | 13.5 | 5 | 14.4 | 12.5 | |||||
| 6 | 14.0 | 12.8 | 6 | 15.4 | 11.8 | |||||
| 7 | 15.0 | 12.1 | 7 | 16.4 | 11.1 | |||||
| 8 | 16.0 | 11.4 | 8 | 17.4 | 10.4 | |||||
| Size Fine Cut Circles: The location at the end of Round 0 is to the upper left, the location at the end of Round 8 is to the lower right. | |||||||||
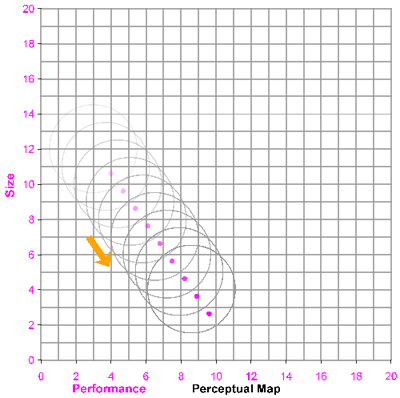 | |||||||||
| Drift Rate: Each year, the segment moves this distance on the Perceptual Map - the segment drifts 1/12th of this distance each month. | |||||||||
| | Pfmn | Size | | ||||||
| 0.7 | -1.0 | ||||||||
| Ideal Spot Offests: The Ideal Spot location relative to the segment center. | |||||||||
| | Pfmn | Size | | ||||||
| 1.0 | -1.4 | ||||||||
| Locations: Segment center and ideal spot locations at the end of each round. | |||||||||
| | | Segment Center | | | Ideal Spot | |||||
| Round | Pfmn | Size | Round | Pfmn | Size | |||||
| 0 | 3.0 | 12.0 | 0 | 4.0 | 10.6 | |||||
| 1 | 3.7 | 11.0 | 1 | 4.7 | 9.6 | |||||
| 2 | 4.4 | 10.0 | 2 | 5.4 | 8.6 | |||||
| 3 | 5.1 | 9.0 | 3 | 6.1 | 7.6 | |||||
| 4 | 5.8 | 8.0 | 4 | 6.8 | 6.6 | |||||
| 5 | 6.5 | 7.0 | 5 | 7.5 | 5.6 | |||||
| 6 | 7.2 | 6.0 | 6 | 8.2 | 4.6 | |||||
| 7 | 7.9 | 5.0 | 7 | 8.9 | 3.6 | |||||
| 8 | 8.6 | 4.0 | 8 | 9.6 | 2.6 | |||||
| Low Tech Fine Cut Circles: The location at the end of Round 0 is to the upper left, the location at the end of Round 8 is to the lower right. | |||||||||
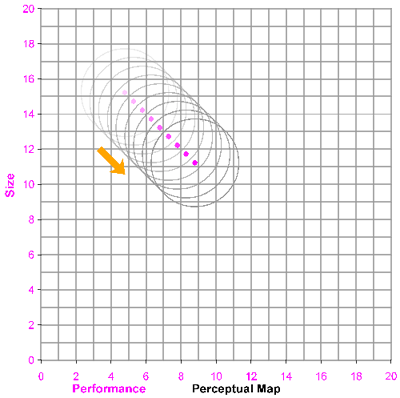 | |||||||||
| Drift Rate: Each year, the segment moves this distance on the Perceptual Map - the segment drifts 1/12th of this distance each month. | |||||||||
| | Pfmn | Size | | ||||||
| +0.5 | -0.5 | ||||||||
| Ideal Spot Offests: The Ideal Spot location relative to the segment center. | |||||||||
| | Pfmn | Size | | ||||||
| 0.0 | 0.0 | ||||||||
| Locations: Segment center and ideal spot locations at the end of each round. | |||||||||
| | | Segment Center | | | Ideal Spot | |||||
| Round | Pfmn | Size | Round | Pfmn | Size | |||||
| 0 | 4.8 | 15.2 | 0 | 4.8 | 15.2 | |||||
| 1 | 5.3 | 14.7 | 1 | 5.3 | 14.7 | |||||
| 2 | 5.8 | 14.2 | 2 | 5.8 | 14.2 | |||||
| 3 | 6.3 | 13.7 | 3 | 6.3 | 13.7 | |||||
| 4 | 6.8 | 13.2 | 4 | 6.8 | 13.2 | |||||
| 5 | 7.3 | 12.7 | 5 | 7.3 | 12.7 | |||||
| 6 | 7.8 | 12.2 | 6 | 7.8 | 12.2 | |||||
| 7 | 8.3 | 11.7 | 7 | 8.3 | 11.7 | |||||
| 8 | 8.8 | 11.2 | 8 | 8.8 | 11.2 | |||||
| High Tech Fine Cut Circles: The location at the end of Round 0 is to the upper left, the location at the end of Round 8 is to the lower right. | |||||||||
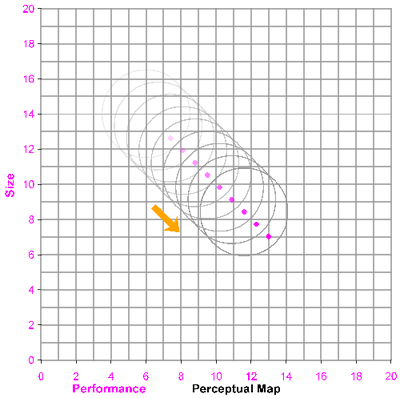 | |||||||||
| Drift Rate: Each year, the segment moves this distance on the Perceptual Map - the segment drifts 1/12th of this distance each month. | |||||||||
| | Pfmn | Size | | ||||||
| 0.7 | -0.7 | ||||||||
| Ideal Spot Offests: The Ideal Spot location relative to the segment center. | |||||||||
| | Pfmn | Size | | ||||||
| 1.4 | -1.4 | ||||||||
| Locations: Segment center and ideal spot locations at the end of each round. | |||||||||
| | | Segment Center | | | Ideal Spot | |||||
| Round | Pfmn | Size | Round | Pfmn | Size | |||||
| 0 | 6.0 | 14.0 | 0 | 7.4 | 12.6 | |||||
| 1 | 6.7 | 13.3 | 1 | 8.1 | 11.9 | |||||
| 2 | 7.4 | 12.6 | 2 | 8.8 | 11.2 | |||||
| 3 | 8.1 | 11.9 | 3 | 9.5 | 10.5 | |||||
| 4 | 8.8 | 11.2 | 4 | 10.2 | 9.8 | |||||
| 5 | 9.5 | 10.5 | 5 | 10.9 | 9.1 | |||||
| 6 | 10.2 | 9.8 | 6 | 11.6 | 8.4 | |||||
| 7 | 10.9 | 9.1 | 7 | 12.3 | 7.7 | |||||
| 8 | 11.6 | 8.4 | 8 | 13.0 | 7.0 | |||||