Page 3 of 6
5.3 Segment Analysis Reports
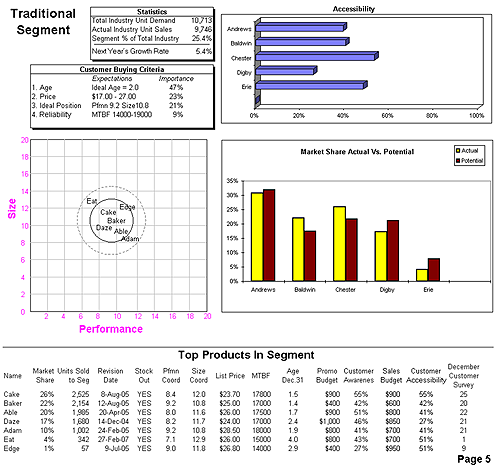
The Market Segment Analysis reports, pages 5 - 9 of the Courier (Figure 5.1), review each market segment in detail.

The Statistics box in the upper-left corner reports Total Industry Unit Demand, Actual Industry Unit Sales, Segment Percent of Total Industry and Next Year’s Growth Rate. The Customer Buying Criteria box ranks the customer criteria within each segment.
- Ideal Position: The preferred product location as of December 31 of the previous year (the preferred location is also called the ideal spot– ideal spots drift with the segments, moving a little each month);
- Price: Every year on January 1, price ranges drop by $0.50– this is the price range from last year;
- Age: Age preferences stay the same year after year;
- Reliability: MTBF requirements stay the same year after year.
Are your products meeting your buyers’ expectations?
The Perceptual Map shows the position of each product in the segment as of December 31 of the previous year.
 5 The Capstone Courier