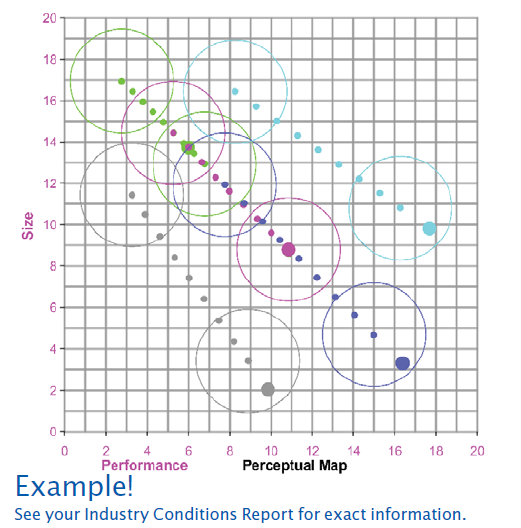
7.1 Perceptual Map
The Research & Development Department can use the Perceptual Map exercise to plan revision and invention projects that meet customers’ shifting size and performance expectations. The Marketing Department can use the results during forecasting as they compare competing products and when determining prices (in general, better positioned products can command higher prices).
Each segment has a set of circles. The inner fine cut circles have a radius of 2.5 units. They represent the heart of the segments where demand is strong. In addition, each inner circle has an ideal spot, a location where demand is strongest. The larger outer rough cut circles have a radius of 4.0 units. They represent the outer fringe of the segments where demand is weak.
7.1.1 Segment Centers and Segment Drift
Tables 1 and 2 in the Industry Conditions Report display information about segment drift.
Table 1 shows the yearly drift rates for each segment. For example, assume the center of the Traditional segment ends Round 0 (the year before the start of the simulation) with a performance of 5.0 and a size of 15.0, and the yearly drift rate for performance is +0.7 (customers want better performing products) and for size is -0.7 (customers want smaller products). At the end of Round 1 the center of the Traditional segment will have a performance of 5.7 and a size of 14.3.
5.0 + 0.7 = 5.7 and 15.0 - 0.7 = 14.3
Table 2 displays the segment center locations at the end of each round.
Print the Perceptual Map Form in the Industry Conditions Report then use Table 2 to find the location of each segment center for Rounds 1 through 7. Mark the approximate locations on the form (see the example in Figure 7.1).

Remember, the locations in Table 2 are the centers of the segment circles, not product positions. Product positions are reported on page 4 of The Capstone Courier.
The locations in Industry Conditions Report Table 2 reflect the segment centers at the end of the round. Therefore, the Round 0 positions can be seen as the Round 1 starting positions, Round 2 positions can be seen as the Round 3 starting position, etc. Each month during the simulation year, the segment drifts 1/12th of the distance from the starting position to the ending position.
7.1.2 Ideal Spots
Customer positioning preferences are reported in the Segment Analysis pages of The Capstone Courier. Within each analysis, the Buying Criteria box displays the ideal performance and size as of December 31 of the previous year. The ideal position is also called the ideal spot. If all other criteria are equal, a customer will prefer a product that is located nearer the ideal spot over a product that is located farther from it.
Some segments place a higher level of importance on positioning than others.
Within each segment, the ideal spot is at a position relative to the center of the circle. Offsets are reported in Table 3 of the Industry Conditions Report. For example, because the High End segment wants cutting edge sensors, its ideal spot is ahead of the center. Suppose the High End center is at Performance 7.4 and Size 11.6. Ideally High End customers want more performance and smaller size. If Table 3 reports “High End. Performance +0.9 | Size -0.9”, then the ideal spot would be at:
Performance 7.4+0.9 = 9.3 and Size 11.6-0.9=10.7
Use Tables 2 and 3 to determine each segment’s ideal spot for Rounds 1 through 7. Enter the results in Form 1.
Form 1: Segment Ideal Spot Locations
|
|
|
|||||||||||||||||||||||||||||||||||||||||||||||||||||||||||||||||||||||||||||||||||||||||||||||||||
|
|
||||||||||||||||||||||||||||||||||||||||||||||||||||||||||||||||||||||||||||||||||||||||||||||||||||
On the Perceptual Map Form, mark the Round 8 ideal spot for each segment.
