4.1.1 Changing Performance, Size and MTBF
A repositioning project moves an existing product from one location on the Perceptual Map to a new location, generally (but not always) down and to the right. Repositioning requires a new size attribute and/or a new performance attribute. To keep up with segment drift, a product must be made smaller (that is, decrease its size) and better performing (that is, increase its performance).
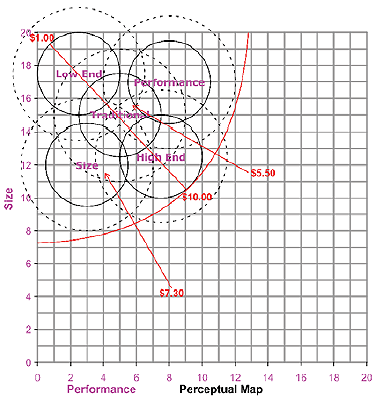
Positioning affects material costs (Figure 4.1). The more advanced the positioning, the higher the cost. At the beginning of the simulation, the trailing edge of the Low End fine cut has the lowest cost, at $1.00; the leading edge of the High End fine cut has the highest cost, at $10.00.

The reliability rating, or MTBF, for existing products can be adjusted up or down. Each 1,000 hours of reliability (MTBF) adds $0.30 to the material cost. A product with 20,000 hours reliability includes $6.00 in reliability costs ($0.30 * 20,000 / 1,000 = $6.00).
Your customers associate MTBF across your product line. Therefore, a low MTBF rating for one product will affect the perception of other products. A product’s effective MTBF is 80% of its MTBF plus 20% of the lowest MTBF in the product line. If a product has an MTBF of 22,000 hours, and the lowest MTBF in the product line is 14,000 hours, the effective MTBF for the fi rst product will be 20,400 hours.
(22,000 * 0.8) + (14,000 * 0.2) = 20,400
Improving positioning and reliability will make a product more appealing to customers but doing so increases material cost. See 8.4.1 Margin Potential.
Material costs displayed in the spreadsheet and reports are the combined positioning and MTBF costs.
