8 CapDebrief and FoundationDebrief - 8.5 Last Round Results
8.5.1 Sales Comparison
Sales Comparison allows instructors to project team comparisons via a bar graph. The chart opens with the bars hidden. This is done for presentation purposes. A row of boxes with each company name displays. Clicking the gray button next to the Andrews name opens a bar chart that shows Andrews Sales, Cost of Goods, Selling and General Admin expenses, Other expenses, and Profits for the year just completed (all figures in dollars).
Once instructors display the charts for all the teams, they can click on the percent sign (%) to show those same items as a percent of sales . Clicking the C to the right of the dollar sign ($) and percent sign (%) clears the display.
8.5.2 Market Share
Market Share presents market share (by dollar) as a pie chart.
8.5.3 Stock Price
Stock Price presents closing stock price as a bar chart.
8.5.4 Plant Comparisons
Plant Comparisons displays the capacities of each company's production line, an indicator of long range strategic plans.
8.5.5 ROS
ROS (Return on Sales ) compares Return on Sales as a bar chart.
8.5.6 Asset Turnover
Asset Turnover compares Asset Turnover as a bar chart.
8.5.7 ROA
ROA (Return on Assets ) compares Return on Assets as a bar chart.
8.5.8 Leverage
Leverage displays each company's total assets at the end of the round just completed, divided by owners' equity for the same period.
8.5.9 ROE
ROE (Return on Equity ) compares Return on Equity as a bar chart.
8.5.10 DuPont Chain
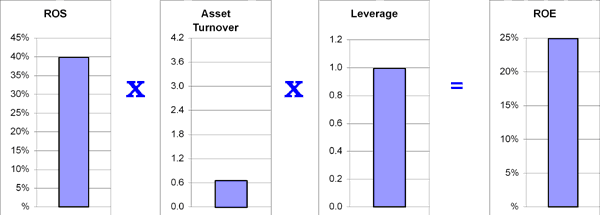
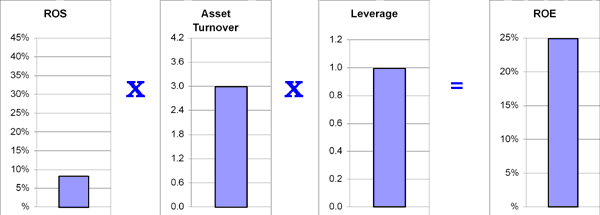
The DuPont Chain equation evaluates each team based on the DuPont Chain of Ratios:
Return On Sales x Asset Turnover x Leverage = Return on Equity
While two companies might have the same Return on Equity (ROE), they could achieve those returns in very different ways. A company that sells differentiated products with high margins and low unit volume would have a DuPont Chain with a high Return on Sales and a low Asset Turnover.

Differentiator: Higher ROS, lower Asset Turnover
A company that sells cost-leading products with low margins and high unit volume would have a DuPont Chain with a low ROS and a high Asset Turnover.

Cost Leader: Lower ROS, higher Asset Turnover
The DuPont Chain component ratios are shown below:
- Return On Sales (or Profitability) = Profit / Sales
- Asset Turnover (or Turnover) = Sales / Assets
- Leverage = Assets / Equity
- Return on Equity = Profit / Equity
