CapDebrief.xls and FoundationDebrief.xls are Microsoft Excel® spreadsheets that connect to the Internet and automatically retrieve simulation results. If the classroom is not connected to the Internet, instructors can download the files in their office, copy the files to a CD or USB device, then take them to the classroom.
CapDebrief.xls and FoundationDebrief.xls can be downloaded from the instructor's Welcome Page.
As these spreadsheets open, instructors might be asked to Enable Macros. Macros are needed for spreadsheet functions.
As these spreadsheets open, instructors might be asked to Enable Macros. Macros are needed for spreadsheet functions.
For Excel® 2003, when the spreadsheet opens this message displays:

Click Enable Macros. If the Enable Macros button is gray, click the "Always trust macros from this source." box and then click Enable Macros. Alternatively, open Excel® to a blank workbook, select tools, macro, security, and change the setting to medium. Click OK then open the spreadsheet via File | Open.
Locate the "Security Warning" message shown below. Click on the "Options" button.

A pop-up box opens. Near the bottom an option setting displays: "Trust all documents from this publisher." Click in the circle then click OK.

As the debrief files continue to open, a login box appears. Instructors enter their Capsim® user ID and password.

Once the login is successful, the debrief files will ask instructors if they want to retrieve the latest set of results.

Clicking Yes will display a list of all current Industry IDs .

Instructors choose an Industry ID then click OK. The debrief files will retrieve the results from the website. Instructors are next given an option to save the file to a local computer. This is a great way to archive results.
Results are stored in a data file called DebriefData.prn, which will copy to the CapDebrief.xls or FoundationDebrief.xls location. If the Excel® file is in the My Documents folder, DebriefData.prn, will copy into My Documents. If instructors plan to take these files to another location, they need to make sure to bring both files.
To display menus in Excel® 2007, click the Add-Ins tab.

The menu bar displays five options:
Please use File | Exit to close the program (versus using the X in the upper right corner of the screen). Using Exit will ensure that the file closes completely and correctly.
The Debrief menu has four submenus:
The menu might be contracted by the Windows Operating System. When this happens, a double-down arrow appears. Clicking the double-down arrow expands the menu to reveal the full contents.

Clicking Start Show brings up the Sales Comparison slide.

Sales Comparison Slide
Sales Comparison allows instructors to project team comparisons via a bar graph. The chart opens with the bars hidden. This is done for presentation purposes. A row of boxes with each company name displays. Clicking the gray button next to the Andrews name opens a bar chart that shows Andrews Sales, Cost of Goods, Selling and General Admin expenses, Other expenses, and Profits for the year just completed (all figures in dollars).
Once instructors display the charts for all the teams, they can click on the percent sign (%) to show those same items as a percent of sales . Clicking the C to the right of the dollar sign ($) and percent sign (%) clears the display.
Market Share presents market share (by dollar) as a pie chart.
Stock Price presents closing stock price as a bar chart.
Plant Comparisons displays the capacities of each company's production line, an indicator of long range strategic plans.
ROS (Return on Sales ) compares Return on Sales as a bar chart.
Asset Turnover compares Asset Turnover as a bar chart.
ROA (Return on Assets ) compares Return on Assets as a bar chart.
Leverage displays each company's total assets at the end of the round just completed, divided by owners' equity for the same period.
ROE (Return on Equity ) compares Return on Equity as a bar chart.
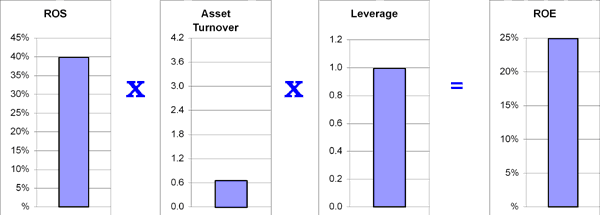
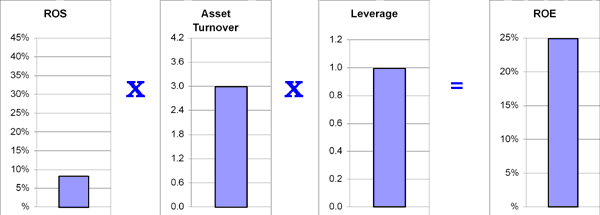
The DuPont Chain equation evaluates each team based on the DuPont Chain of Ratios:
While two companies might have the same Return on Equity (ROE), they could achieve those returns in very different ways. A company that sells differentiated products with high margins and low unit volume would have a DuPont Chain with a high Return on Sales and a low Asset Turnover.

Differentiator: Higher ROS, lower Asset Turnover
A company that sells cost-leading products with low margins and high unit volume would have a DuPont Chain with a low ROS and a high Asset Turnover.

Cost Leader: Lower ROS, higher Asset Turnover
The DuPont Chain component ratios are shown below:

The Results To Date contain cumulative information for all rounds played. Clicking Start Show in the submenu brings up the Ending Profit comparison slide.
The other slides include:
The Scores to Date slide show starts with the Success Measurement Weights . The Scoring section uses the Ranking method for displaying Success Measure results. Relative measures are available on the website (see Weighted Relative in Section 3.8.2 Success Measures).

Weights are taken from the information entered on the website's Success Measurement page in the Homework section (either by instructors or participants, see Section 3.9.3 Entering Success Measures). The criteria determined by instructors also have an impact on results. Capsim® suggests:
Selecting each company name displays a ranking of all companies based on the selected company's performance measurements.
Each company gets 1 base point for itself and 1 for each inactive team: If there are no inactive teams, then the base score will be 1, if there is one inactive team, then the base score will be 2, if there are two inactive companies, then the base score will be 3, etc. Companies get an additional point for each active (participant or computer) company they beat. These points are then multiplied by the success measure weights.
For example, suppose there are six teams. Andrews got the highest ROE and Baldwin the lowest. Andrews gets 1 point for themselves and 5 points for beating the other teams. Total raw score = 6 points. Baldwin gets 1 point for coming in last. However, suppose Andrews weights ROE at 0% and Baldwin at 20%. Andrews final score would be 6 X 0 = 0. Baldwin would get 1 X 0.2 = 0.2 points. A perfect score is always 6.0 overall, which is equivalent to saying, "On every performance measure we picked, we came in first."
This section displays an overall ranking based on how well each company lived up to their own performance measurements, juxtaposed with how well the other teams lived up to theirs. For example, let's say Baldwin chose 50% Asset Turnover and 50% Market Share as their measurements. It is possible that they could be number one in Profits, Stock Price , ROE, ROA and ROS, yet still lose.
The Print Show submenu will send the Last Round Results , End Results and Final Score slides to your default printer.

Note: If instructors wish to change the default printer, they should go to the printer folder (Start Button | Settings) right-click on the desired printer and click on default.

These reports are identical to the reports available to participants in Capstone.xls and Foundation.xls (see Capstone® Courier or Foundation® FastTrack).

After selecting a team, click on View Annual Report to see that team's report:
For example, if instructors want to review the Chester team's detailed Income Statement, they would click on Select Team's Annual Report, select Chester , then click View Annual Report Page and select 2. Income Statement.