In any month, a product’s demand is driven by its monthly customer survey score. Assuming it does not run out of inventory, a product with a higher score will outsell a product with a lower score.
Customer survey scores are calculated 12 times a year. The December customer survey scores are reported in the Capstone Courier’s Segment Analysis pages.
A customer survey score reflects how well a product meets its segment’s buying criteria. Company promotion, sales and accounts receivable policies also affect the survey score.
Scores are calculated once each month because a product’s age and positioning change a little each month. If during the year a product is revised by Research and Development, the product’s age, positioning and MTBF characteristics can change quite a bit. As a result, it is possible for a product with a very good December customer survey score to have had a much poorer score – and therefore poorer sales – in the months prior to an R&D revision.
Prices, set by Marketing at the beginning of the year, will not change during the year.
3.1 Buying Criteria and the Customer Survey Score
The customer survey starts by evaluating each product against the buying criteria. Next, these assessments are weighted by the criteria’s level of importance. For example, some segments assign a higher importance to positioning than others. A well-positioned product in a segment where positioning is important will have a greater overall impact on its survey score than a well-positioned product in a segment where positioning is not important.
The Industry Conditions Report and the Courier’s Market Segment Analysis pages break down each segment’s criteria in order of importance.
A perfect customer survey score of 100 requires that the product: Be at the ideal position (the segment drifts each month, so this can occur only one month per year); be priced at the bottom of the expected range; have the ideal age for that segment (unless they are revised, products grow older each month, so this can occur only one month per year); and have an MTBF specification at the top of the expected range.
Your customers want perfection, but it is impractical to have “perfect” products. In many cases you will have to settle for “great” products, but the better the products, the higher the costs. Your task is to give customers great products while still making a profit. Your competitors face the same dilemma.
3.1.1 Positioning Score
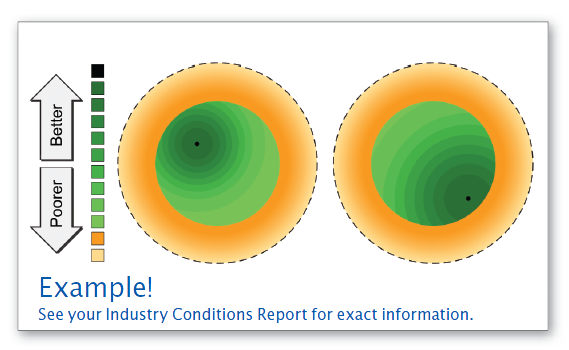
Marketers must understand both what customers want and their boundaries. In terms of a product’s size and performance (as discussed in “Section 2.1.5”), the Perceptual Map illustrates these ideas with circles. Each segment is described with a dashed outer circle, a solid inner circle and a dot representing the ideal position called the ideal spot (Figure 3.1).
Rough Cut Circle
The dashed outer circle defines the outer limit of the segment. Customers are saying, “I will NOT purchase a product outside this boundary.” We call the dashed circle the rough cut boundary because any product outside of it “fails the rough cut” and is dropped from consideration. Rough cut circles have a radius of 4.0 units.
Fine Cut Circle
The solid inner circle defines the heart of the segment. Customers prefer products within this circle. We call the inner circle the fine cut because products within it “make the fine cut.” Fine cut circles have a radius of 2.5 units.
Ideal Spot
The ideal spot is that point in the heart of the segment where, all other things being equal, demand is highest.
Segment Movement
Each segment moves across the Perceptual Map a little each month. In a perfect world your product would be positioned in front of the ideal spot in January, on top of the ideal spot in June and trail the ideal spot in December. In December it would complete an R&D project to jump in front of the ideal spot for next year.
Positioning Rough Cut
Products placed in the rough cut area (orange rings, Figure 3.1) are between 2.5 and 4.0 units from the center of the circle. Products here are poorly positioned and they will have reduced customer survey scores. The farther they are from the fine cut circle, the more the scores are reduced. Just beyond the fine cut, scores drop 1%.
Halfway across the rough cut, scores drop 50%. Scores drop 99% for products that are almost to the edge of the rough cut. Sensors that are about to enter the rough cut can be revised by Research & Development (see “4.1.1 Changing Performance, Size and MTBF”). The location of each segment’s rough cut and fine cut circles as of December 31 of the previous year appears on page 11 of the Courier.
Positioning Fine Cut
Products inside the fine cut (green areas, Figure 3.1,) are within 2.5 units of the center of the circle. Ideal spots for each segment are illustrated by the black dots. The example on the left illustrates a segment that prefers proven, inexpensive technology. The ideal spot is to the upper left of the segment center, where material costs are lower. The example on the right illustrates a segment that prefers cutting-edge technology. The ideal spot is to the lower right of the segment center, where material costs are higher (see Figure 4.1 for an illustration of material positioning costs).
Participants often ask, “Why are some ideal spots ahead of the segment centers?” The segments are moving. From a customer’s perspective, if they buy a product at the ideal spot, it will still be a cutting edge product when it wears out. For contrast, if they buy a product at the trailing edge, it will not be inside the segment when it wears out.
A product’s positioning score changes each month because segments and ideal spots drift a little each month. Placing a product in the path of the ideal spot will return the greatest benefit through the course of a year.
3.1.2 Price Score
Every segment has a $10.00 price range. Customers prefer products–the ideal–towards the bottom of the range. Price ranges in all segments drop $0.50 per year.
Segment price expectations correlate with the segment’s position on the Perceptual Map. Segments that demand higher performance and smaller sizes are willing to pay higher prices.
Price ranges for Round 0 (the year prior to Round 1) are published in the Industry Conditions Report and the Segment Analysis pages of the Capstone Courier.
Price Rough Cut
Sensors priced $5.00 above or below the segment guidelines will not be considered for purchase. Those products fail the price rough cut.
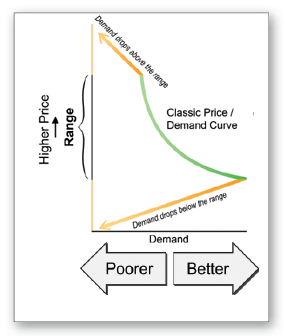
Sensors priced $1.00 above or below the segment guidelines lose about 20% of their customer survey score (orange arrows, Figure 3.2). Sensors continue to lose approximately 20% of their customer survey score for each dollar above or below the guideline, on up to $4.99, where the score is reduced by approximately 99%. At $5.00 outside the range, demand for the product is zero.
Price Fine Cut
Within each segment’s price range, price scores follow a classic economic demand curve (green curve, Figure 3.2): As price goes down, the price score goes up.
3.1.3 MTBF Score
Each segment sets a 5,000 hour range for MTBF (Mean Time Before Failure), the number of hours a product is expected to operate before it malfunctions. Customers prefer products towards the top of the range.
MTBF Rough Cut
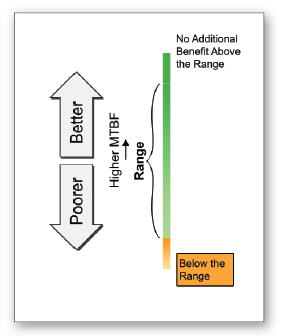
Demand scores fall rapidly for products with MTBFs beneath the segment’s guidelines. Products with an MTBF 1,000 hours below the segment guideline lose 20% of their customer survey score. Products continue to lose approximately 20% of their customer survey score for every 1,000 hours below the guideline, on down to 4,999 hours, where the customer survey score is reduced by approximately 99%. At 5,000 hours below the range, demand for the product falls to zero.
MTBF Fine Cut
Within the segment’s MTBF range, the customer survey score improves as MTBF increases (Figure 3.3). However, material costs increase $0.30 for every additional 1,000 hours of reliability. Customers ignore reliability above the expected range– demand plateaus at the top of the range.
3.1.4 Age Score
The age criteria do not have a rough cut; a product will never be too young or too old to be considered for purchase.
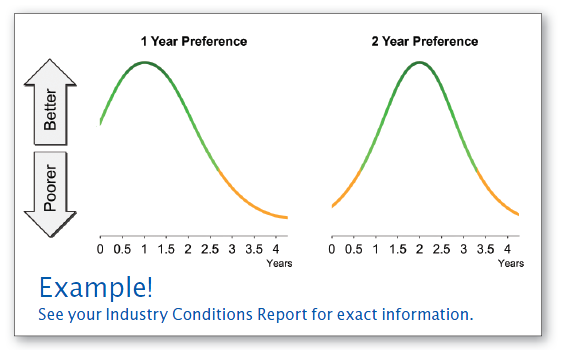
Customers demanding cutting-edge technology prefer newer products. The ideal ages for these market segments are generally one and a half years or less. Other segments prefer proven technology. These segments seek older designs.
Each month, customers assess a product’s age and award a score based upon their preferences. Examples of age preferences are illustrated in Figure 3.4.
Age preferences for each segment are published in the Industry Conditions Report and the Segment Analysis pages of the Capstone Courier.
3.2 Estimating the Customer Survey Score
The customer survey score drives demand for your product in a segment. Your demand in any given month is your score divided by the sum of the scores. For example, if your product’s score in April is 20 and your competitors’ scores are 27, 19, 21 and 3, then your product’s April demand is:
20 / (20 + 27 + 19 + 21 + 3) = 22%
Assuming you had enough inventory to meet demand, you would receive 22% of segment sales for April.
What generates the score itself? Marketers speak of “the 4 P’s” – price, product, promotion and place. Price and product are found in the buying criteria. Together they present a price-value relationship. Your promotion budget builds “awareness,” the number of customers who know about your product before sourcing. Your sales budget (place) builds “accessibility,” the ease with which customers can work with you after they begin sourcing. To the 4 P’s we can add two additional elements– credit terms and availability. Credit terms are expressed by your accounts receivable (A/R) policy. Availability addresses inventory shortages.
3.2.1 Base Scores
To estimate the customer survey score, begin with the buying criteria available in the Courier’s Segment Analysis reports. For example, suppose the buying criteria are:
- Age, 2 years– importance: 47%
- Price, $20.00-$30.00– importance: 23%
- Ideal Position, size 15.0 /performance 5.0– importance: 21%
- MTBF, 14,000-19,000– importance: 9%
A perfect score of 100 requires that the product have an age of 2.0 years, a price of $20.00, a position at the ideal spot (5.0 and 15.0) and an MTBF of 19,000 hours.
The segment weighs the criteria at: Age 47%, Price 23%, Positioning 21% and MTBF 9%. You can convert these percentages into points then use these numbers to estimate a base score for your product. For example, price is worth 23 points. The perfect Round 0 price of $20.00 would get 23 points, but at the opposite end of the price range, a price of $30.00 would only get one point.
You can use the age and positioning charts in your Industry Conditions Report to estimate average points for those criteria.
However, the base score can fall because of poor awareness (promotion), accessibility (place) or the credit terms you extend to your customers.
3.2.2 Accounts Receivable
A company’s accounts receivable policy sets the amount of time customers have to pay for their purchases. At 90 days there is no reduction to the base score. At 60 days the score is reduced 0.7%. At 30 days the score is reduced 7%. Offering no credit terms (0 days) reduces the score by 40% (see “4.4.5 Credit Policy”).
3.2.3 Awareness and Accessibility
After your product leaves the factory and enters the marketplace, the calculations for its score become less exact. The score will be affected by the level of the product’s awareness (the percentage of people who know about your product) and its segment’s accessibility (the number of customers who can easily interact with your company).
Awareness is built over time by the product’s promotion budget. Promotion budgets fund advertising and public relations campaigns.
Accessibility is built over time by the product’s sales budget. Sales budgets fund salespeople and distribution systems to service customers within the product’s market segment.
Similar products with higher awareness and accessibility will score better than those with lower percentages (see “4.2 Marketing” for more information on awareness and accessibility).
If the TQM/Sustainability module is enabled, some initiatives can increase the customer survey score (see “7.1 TQM/Sustainability”).
3.3 Stock Outs and Seller’s Market
What happens when a product generates high demand but runs out of inventory (stocks out)? The company loses sales as customers turn to its competitors. This can happen in any month.
The Market Share Report of the Capstone Courier (page 10) can help you diagnose stock outs and their impacts.
Usually, a product with a low customer survey score has low sales. However, if a segment’s demand exceeds the supply of products available for sale, a seller’s market emerges. In a seller’s market, customers will accept low-scoring products as long as they fall within the segment’s rough cut limits. For example, desperate customers with no better alternatives will buy:
- A product positioned just inside the rough cut circle on the Perceptual Map– outside the circle they say “no” to the product;
- A product priced $4.99 above the price range– at $5.00 customers reach their tolerance limit and refuse to buy the product; and
- A product with an MTBF 4,999 hours below the range– at 5,000 hours below the range customers refuse to buy the product.
Watch out for three common tactical mistakes in a seller’s market:
- After completing a capacity analysis, a company decides that industry demand exceeds supply. They price their product $4.99 above last round’s published price range, forgetting that price ranges fall by $0.50 each round. Demand for the product becomes zero. They should have priced $4.49 above last year’s range.
- A company disregards products that are in the positioning rough cut. These products normally can be ignored because they have low customer survey scores. However, when the company increases the price, the customer survey score falls below the products in the rough cut areas, which are suddenly more attractive than their product.
- The company fails to add capacity for the next round. A seller’s market sometimes appears because a competitor unexpectedly exits a segment. This creates a windfall opportunity for the remaining companies. (However, a well-run company will always have enough capacity to meet demand from its customers.)
How can you be sure of a seller’s market? You can’t, unless you are certain that industry capacity, including a second shift, cannot meet demand for the segment. In that case, even very poor products will stock out as customers search for anything that will meet their needs.
See “How Is the Customer Survey Score Calculated?” for more information on assessing your products.


