Marketing functions vary widely depending on the industry and company. In general, the department drums up interest in the company’s products or services through a mix of activities. These can include advertising, public relations and good old fashioned salesmanship.
Your Marketing Department is concerned with the remaining P’s (beyond R&D’s product): Price, place and promotion. Your Marketing Department is also in charge of sales forecasting.
4.2.1 Pricing Sensors
Price was discussed in 3.1.2. To review, appeal falls to zero when prices go $5.00 above or below the expected price range. Price drives the product’s contribution to profit margin. Dropping the price increases appeal but reduces profit per unit.
Segment price ranges fall at a rate of $0.50 per year. For example, if in Round 0, Traditional customers expect a price between $20.00 and $30.00, then in Round 1, the Traditional price range will be $19.50-$29.50; Round 2, $19.00-$29.00, etc. This puts pressure on companies to improve their cost structures.
4.2.2 Promotion and Sales Budgets
Promotion and sales budgets affect product appeal. See “3.2 Estimating the Customer Survey Score” for more information.
Promotion
Each product’s promotion budget determines its level of awareness. A product’s awareness percentage reflects the number of customers who know about the product. An awareness of 50% indicates half of the potential customers know it exists. From one year to the next, a third (33%) of those who knew about a product forget about it.
Last Year’s Awareness - (33% * Last Year’s Awareness) = Starting Awareness
If a product ended last year with an awareness of 50%, this year it will start with an awareness of approximately 33%. This year’s promotion budget would build from a starting awareness of approximately 33%.
Starting Awareness + Additional Awareness From Figure 4.2 = New Awareness
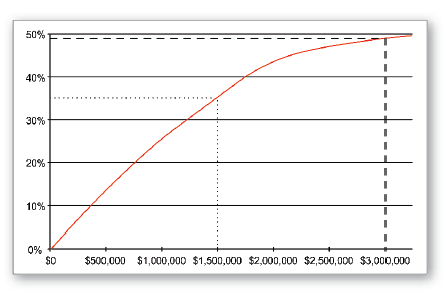
Figure 4.2 indicates a $1,500,000 promotion budget would add 36% to the starting awareness, for a total awareness of 69% (33 + 36 = 69).
Figure 4.2 indicates a $3,000,000 budget would add just under 50% to the starting awareness, roughly 14% more than the $1,500,000 expenditure (33 + 50 = 83). This is because further expenditures tend to reach customers who already know about the product. Once your product achieves 100% awareness, you can scale back the product’s promotion budget to around $1,400,000. This will maintain 100% awareness year after year.
The Courier’s Segment Analysis reports (pages 5-9) publish awareness.
New products are newsworthy events. The buzz creates 25% awareness at no cost. The 25% is added to any additional awareness you create with your promotion budget.
Sales
Each product’s sales budget contributes to segment accessibility. A segment’s accessibility percentage indicates the number of customers who can easily interact with your company via salespeople, customer support, delivery, etc. Like awareness, if your sales budgets drop to zero, you lose one third of your accessibility each year. Unlike awareness, accessibility applies to the segment, not the product. If your product exits a segment, it leaves the old accessibility behind. When it enters a different segment, it gets that segment’s accessibility.
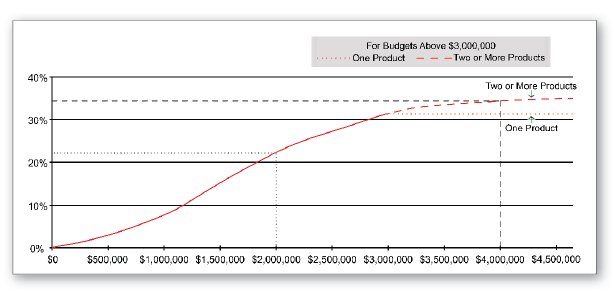
If you have two or more products that meet a segment’s fine cut criteria, the sales budget for each product contributes to that segment’s accessibility. The more products you have in the segment’s fine cut, the stronger your distribution channels, support systems, etc. This is because each product’s sales budget contributes to the segment’s accessibility.
If you have one product in a segment, there is no additional benefit to spending more than $3,000,000. If you have two or more products in a segment, there is no additional benefit to spending more than a $4,500,000 split between the products, for example, two products with sales budgets of $2,250,000 each (see Figure 4.3).
Sales budgets are less effective when products are not completely positioned in the fine cut circle, when prices rise above or below segment guidelines or when MTBFs fall below segment guidelines.
Achieving 100% accessibility is difficult. You must have two or more products in the segment’s fine cut. Once 100% is reached, you can scale back the combined budgets to around $3,500,000 to maintain 100%.
The Courier’s Segment Analysis reports (pages 5-9) publish accessibility.
Awareness and Accessibility
Think of awareness and accessibility as “before” and “after” the sale. The promotion budget drives awareness, which persuades the customer to look at your product. The sales budget drives accessibility, which governs everything during and after the sale. The promotion budget is spent on advertising and public relations. The sales budget is spent on distribution, order entry, customer service, etc. Awareness and accessibility go hand and hand in making the sale. The former is about encouraging the customer to choose your product; the latter is about closing the deal via your salespeople and distribution channels.
4.2.3 Sales Forecasting
Accurate sales forecasting is a key element to company success. Manufacturing too many units results in higher inventory carrying costs. Manufacturing too few units results in stock outs and lost sales opportunities, which can cost even more (see “8 Forecasting”).
Log into the Capstone Spreadsheet and click the Decisions menu. Select Marketing. Use this area to determine each product’s Price, Promotion Budget, Sales Budget and Sales Forecast. What’s the difference between the Computer Prediction and Your Sales Forecast? The Computer Prediction cannot consider what your competitors are actually doing. It does not know. Instead, it assumes each of your competitors will offer one mediocre product (with a customer survey score of 20) in each segment. It benchmarks how your product would do against this mediocre playing field.
The Computer Prediction, expressed as units demanded, changes as you make decisions about your product.
You use the Computer Prediction to evaluate the impact your decisions will have upon your product’s appeal. For example, you can estimate the impact a price change will have upon demand. The Your Sales Forecast column overrides the Computer Prediction with your own prediction (see “8 Forecasting”). Until you provide a sales forecast, the computer uses its mediocre Computer Prediction to predict your proforma financial statements. Always override the Computer Prediction with your own forecast.
The remaining cells display the financial impacts of your decisions:
- Gross Revenue Forecast (Price multiplied by either the Computer Prediction or, if entered, Your Sales Forecast.)
- Variable Costs (Labor, Material and Inventory Carrying costs subtracted from the Gross Revenue Forecast.)
- Contribution Margin Forecast (Gross Revenue minus variable costs.)
- Less Promotion and Sales (Contribution Margin Forecast minus the product’s Promotion Budget and Sales Budget.)
The Rehearsal Tutorial’s Marketing Tactics show you how to run the department. Log in at the Capsim website and go to Getting Started for information about the Rehearsal.

