Your customers fall into five groups which are called market segments. A market segment is a group of customers who have similar needs. The segments are named for the customer’s primary requirements, and are called:
- Traditional
- Low End
- High End
- Performance
- Size
At the beginning of the simulation, Traditional and Low End make up the majority of the unit sales. However, the Traditional and Low End growth rates trail the growth rates for High End, Performance and Size. By year five, High End, Performance and Size will command a greater percentage of the overall market.
The Industry Conditions Report, available from the website’s Reports link, lists market segment sales percentages and projected growth rates for your simulation.
2.1 Buying Criteria
Customers within each market segment employ different standards as they evaluate products. They consider four buying criteria: Price, Age, MTBF (reliability), and Positioning.
2.1.1 Price
Each segment has different price expectations. For example, Low End customers seek inexpensive products while High End customers, who need premium products, are willing to pay higher prices.
2.1.2 Age
Each segment has different age expectations, that is, the length of time since the product was invented or revised. High End customers want brand new technology while Traditional customers prefer technology that has been in the market for a few years (see 4.1.4 A Sensor’s Age).
2.1.3 MTBF (Mean Time Before Failure) or Reliability
MTBF (Mean Time Before Failure) is a measure of reliability. Each segment has a different MTBF criteria. Performance customers are extremely interested in high MTBFs while Low End customers are satisfied with lower MTBFs.
2.1.4 Positioning
Sensors vary in their dimensions (size) and the speed/sensitivity with which they respond to changes in physical conditions (performance). Combining size and performance creates a product attribute called positioning.
The Perceptual Map
Positioning is such an important concept that marketers developed a tool to track the position of their products and those of their competitors. This tool is called a Perceptual Map. Note the Perceptual Map in Figure 2.1. You will see this map quite often through the course of the simulation. The map measures size on the vertical axis and performance on the horizontal axis. The arrow points to a product called Able with a performance of 8 and a size of 12.

2.1.5 Market Segment Positions on the Perceptual Map
Customers within each market segment have different positioning preferences. Low End customers want inexpensive products that are slow performing and are large in size. They want products that fall inside the set of circles to the upper left in Figure 2.2. High End customers want products that are fast performing and small in size. They want products that fall within the set of circles to the lower right.
Over time, your customers expect products that are smaller and faster. This causes the segments to move or drift a little each month. As the years progress, the drift becomes significant. Figure 2.3 shows the location of the market segments at the end of the fourth year. Figure 2.4 shows the segments at the end of the eighth year.


High End, Performance and Size customers demand greater product improvement than Traditional and Low End customers. Therefore the High End, Performance and Size market segments drift at a faster rate. As time goes on, the overlap between the segments is less and less.
Drift rates are published in the Industry Conditions Report.
Market segments will not move faster to catch up with products that are better than their expectations. High End customers will refuse to buy a product to the lower right of the circles. Customers are only interested in products that fall within the circles on the Perceptual Map!
In the simulation, there are zero customers interested in products positioned outside of the dashed circles.
Your R&D and Marketing Departments have to make sure your products keep up with changing customer positioning requirements. To do this, R&D must reposition products, keeping them within the moving segment circles. See 4.1 Research & Development (R&D) for more information.
Perceptual Maps can be used to plot any two product characteristics. For example, cereal manufacturers could plot nutrition and taste. The dots in the figure to the right represent sales of breakfast cereals based on ratings of taste and nutrition. There are few sales in the upper left corner– not many consumers want products that have poor taste and poor nutrition.
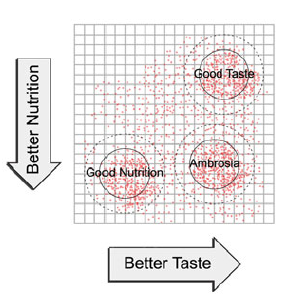 As they review product sales, marketers would notice three distinct clusters; the cluster to the lower left indicates a group of customers that is more interested in nutrition than taste. The cluster to the upper right indicates a group that is more interested in taste than nutrition. The cluster to the lower right indicates a group that wants both good taste and good nutrition.
The clusters, or market segments, could then be named “Taste,” “Nutrition” and “Ambrosia.” The simulation uses a similar positioning method to name its market segments.
2.2 Buying Criteria by Segment
Buyers in each segment place a different emphasis upon the four buying criteria. For example, Low End customers are most interested in price, while High End customers are most interested in positioning. Positioning and price criteria change each year. Age and MTBF criteria remain the same year after year.
Buying Criteria for the previous year are reported in the Capstone Courier’s Segment Analysis pages. As you take over the company to make decisions for Round 1, your reports reflect customer expectations as of December 31, Round 0 (yesterday). The Industry Conditions Report displays the Round 0 buying criteria for each market segment. Here are two example segments.
Example 1 customers seek proven products at a modest price.
- Age, 2 years– importance: 47%
- Price, $20.00-$30.00– importance: 23%
- Ideal Position, performance 5.0 size 15.0– importance: 21%
- MTBF, 14,000-19,000– importance: 9%
Example 2 customers seek cutting-edge technology in size/performance and new designs.
- Ideal Position, performance 8.9 size 11.1– importance: 43%
- Age, 0 years– importance: 29%
- MTBF, 20,000-25,000– importance: 19%
- Price, $30.00-$40.00– importance: 9%